

Most practices don’t lose money in one big way. They lose it in small leaks: a wrong insurance ID, a late charge, and a denial nobody appeals. Industry estimates say medical groups lose 3% to 5% of net revenue to weak billing processes.
Denials are the biggest leak, and they are growing. A recent survey found that 41% of providers see denial rates of 10% or higher, up from 30% in 2022. Premier found that about 15% of claims are denied at first, and each one costs about $43.84 to rework.
You can’t fix what you don’t measure. Practices that track the right numbers each month catch problems early. The rest find out when cash runs short.
What Are KPIs in the Healthcare Revenue Cycle?
KPIs, or key performance indicators, are numbers that show how well your billing process works, from check-in to final payment. You need the few that warn you before the engine fails.
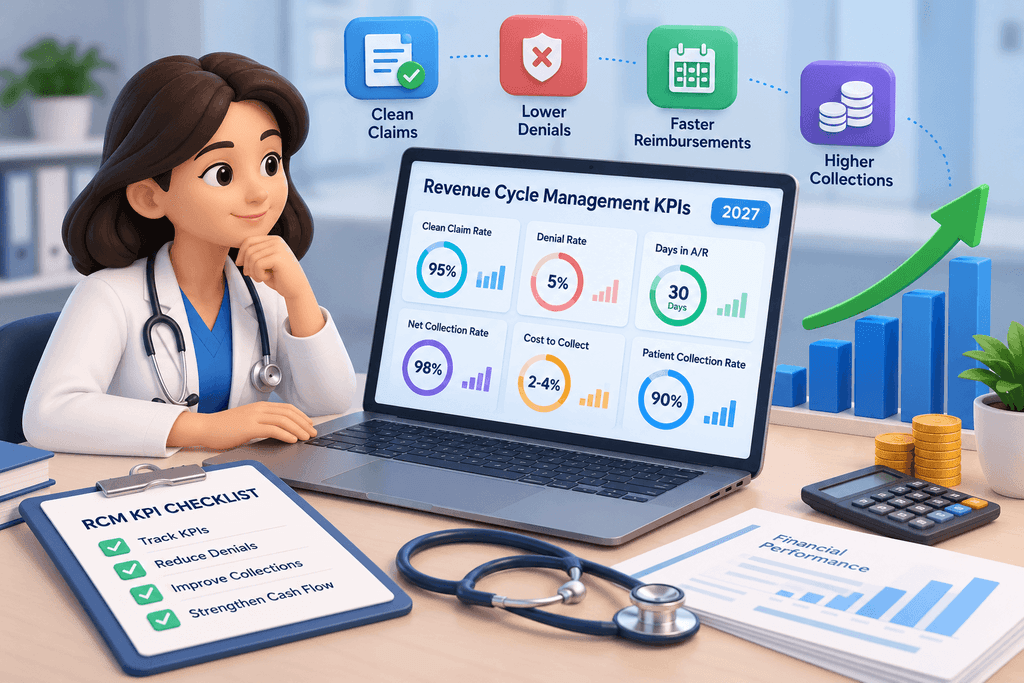
The top KPIs in healthcare RCM are clean claim rate, days in A/R, denial rate, net collection rate, and cost to collect. They all are linked. A low clean claim rate causes more denials. More denials stretch your A/R days and pull down your collections. One weak KPI usually hurts the others.
Top Revenue Cycle Management KPIs to Track in 2027
KPIs fall into three stages: front-end, mid-cycle, and back-end. Each has its own risks. Experts found that missing or inaccurate claim data causes 50% of denials, and many of those errors start at the front desk. Tracking by stage shows exactly where money slips away.
Front-End KPIs (Patient Access & Financial Clearance)
Front-end processes establish the foundation for accurate billing. Errors in patient registration, insurance eligibility, or appointment management can create claim rejections and collection delays later.
Clean Claim Rate (CCR)
Target: Ideally above 95%.
The share of claims accepted by the payer the first time. A clean claim ratio of 95% or higher is required for healthcare practices. Below 90% points to front-end problems like bad eligibility checks. Track it by payer, since a 97% overall rate can hide a 78% rate with one Medicaid plan.
Charge Lag Days
Target: Ideally 1–3 days or less.
This is the time between the visit and charge entry. Industry guidance says to bill within two days or less. Slow entry delays payment and raises the risk of missed charges and timely filing denials.
Target: Below 5%, where practical.
Many sources report averages well above 5%, so this goal takes work. Text reminders, online booking, and clear cancellation rules help. One review found that reminders sent 24 to 48 hours ahead cut no-shows by about 29%.
Mid-Cycle KPIs (Coding, Documentation & Claim Submission)
Mid-cycle performance determines whether the services delivered are documented correctly, coded accurately, and submitted according to payer requirements. Weaknesses at this stage lead to denials, underpayments, and repeated billing work.
Coding Accuracy Rate
This shows how often codes match the visit notes. US compliance programs commonly set 95% or higher as the coder standard. Errors cause denials, underpayment, and audit risk. Conduct regular coding audits, provide focused staff training, and ensure documentation supports the codes billed.
First-Pass Resolution Rate (FPRR)
Target: 90% or higher.
The percentage of claims paid on the first submission. A claim can pass the clearinghouse and still be denied by the payer; it shows what really got paid. Below 90%, check coding, authorizations, and eligibility.
Initial Denial Rate
Target: Under 5%, as a useful operational goal.
Experts call under 5% optimal, and the industry average is 5% to 10%. Break it down by payer, CPT code, and reason. Top causes are missing claim data, authorizations, and patient registration errors.
Back-End KPIs (Accounts Receivable, Collections & Cash Flow)
Back-end KPIs show whether submitted claims turn into payments and whether outstanding balances are collected efficiently. Reviewing them regularly helps practices protect cash flow and identify revenue that may be at risk.
Days in Accounts Receivable (A/R)
Target: Ideally 30 days or less.
Days in A/R estimate how long it takes a practice to collect outstanding revenue. A higher figure can signal slow payer processing, delayed follow-ups, or unresolved billing issues. Industry benchmarks are under 40 days, and top performers stay below 30. For the past 50 days, something has been stuck in billing or follow-up.
Net Collection Rate (NCR)
Target: Approximately 96%–99% for many healthy practices.
Net collection rate measures the percentage of collectible revenue actually collected after contractual adjustments and other defined exclusions. A low rate may mean the practice is not collecting all the revenue it is entitled to receive. However, the calculation must consistently account for contractual allowances and avoidable write-offs.
Aged Accounts Receivable
Old balances are hard to collect. Keep A/R over 90 days at or below 10% of the total. Above 15% to 20% is a red flag. Generate aging reports by payer and balance, assign follow-up ownership, and prioritize claims approaching filing or appeal deadlines.
Denial Rate
The overall denial rate measures the proportion of claims denied during a defined period. Unlike the initial denial rate, its calculation may include different stages of claim processing, depending on the practice’s methodology. A high rate reduces cash flow and increases the cost of billing operations.
Appeal Success Rate
This KPI measures the proportion of appealed denials that are overturned or otherwise resolved favorably. A low success rate may indicate weak supporting documentation, missed appeal requirements, or poor prioritization of appeal cases.
Patient Responsibility Collection Rate
This metric measures how effectively the practice collects amounts owed by patients, such as deductibles, copayments, and coinsurance. Patients can pay up to 30% of practice revenue. Collect at the time of service when you can. A common front-desk goal is 90% of the patient’s portion at check-in.
Cost to Collect
Target: 2%–4% of collections, depending on practice type and accounting method.
Total revenue cycle cost divided by what you collect. Industry insights say the best-practice standard has fallen from 3% to 2%. If yours runs high, denial rework is a likely cause.
How Outsourcing RCM Services Helps You Use This Checklist
A 14-item checklist is great on paper. In real life, a small team runs the front desk, posts payments, chases denials, and builds reports. A recent report says that 43% of providers are understaffed.
An outsourced RCM service partner helps in four ways:
- Daily tracking of KPIs by payer and by reason, not once a quarter.
- Cleaner claims from trained coders and claim scrubbers.
- Faster denial work, so winnable claims don’t expire.
- Lower cost to collect, since you avoid extra hires and software.
Conclusion
KPIs show where money slips out, and they show it early. Start by establishing a baseline for clean claim rate, charge lag, denial rate, days in A/R, net collection rate, and cost to collect. Then assign owners, review trends monthly, and investigate metrics that move in the wrong direction.
Set a target for each, review monthly, and fix the weakest link first. With denial rates still climbing, practices that track KPIs closely in 2027 will be the ones paid on time.
FAQs
Aim for 95% or higher. Below 90% usually points to front-end errors.
Under 40 days is the common benchmark. High performers keep it at 30 or less.
A clean claim rate shows claims accepted without errors. The first-pass resolution rate shows claims actually paid on the first try.
Check the clean claim rate and A/R aging weekly. Review the full set monthly, by payer.
Consider outsourced RCM services if denials are rising, A/R over 90 days keeps growing, or your billing staff is overloaded.